The Cool Runnings Count
An investigation into (relative) Olympic performance
Watching the Sochi Olympics got me thinking about medal counts. Coverage emphasizes total medal count as an indicator of which country is currently "winning" in the Games. Is this the right way to think about Olympic success on a country by country basis?
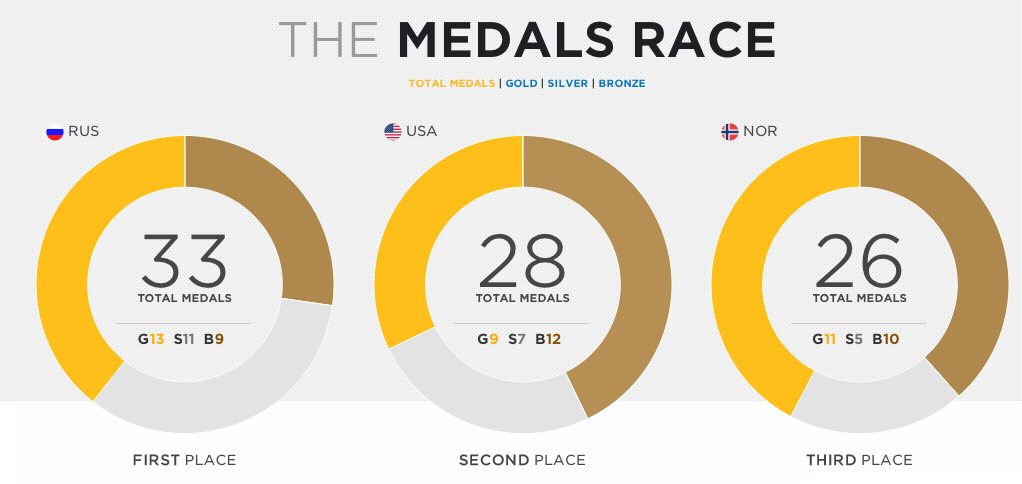
As a performance indicator, at least it is straightforward and transparent. It's hard to argue with the Russian's 33 medals or the U.S.'s 28. But, what about Norway, who came in a slight "3rd" place 26 medals? Pretty outstanding for a country that has about 1/60th the population of the U.S. But just how outstanding is this? Thinking back to the movie Cool Runnings, just how impressive was it that Jamaica had a bobsled team?
Here is my basic question:
how can we tell if a country performed relatively better (or worse)
than we would expect in the Olympics?
how can we tell if a country performed relatively better (or worse) than we would expect in the Olympics?
At first glance, I guessed that a country's population and wealth are probably the two best predictors of a country's success in any given Olympic games. I haven't taken a bio class since high school, but I imagine that population is correlated with genetic diversity and that the broader a country's gene pool the more likely that country is to produce a phenom like Michael Phelps.
Wealth enables leisure. Sports are essentially leisure activities. Wealthy countries can invest in training facilities and enable kids to train and compete from an earlier age.
My hypothesis is that country X's Olympic performance is to a large degree determined by GDPx and populationx and that we should measure X's performance not by total medal count, but by whether X performed better or worse than expected, given GDPx and populationx.
Before I begin
This is a decent hypothesis to test. At this point all I need is data, right? Hold up! Someone has probably already done this analysis! So a quick Google search immediately turns up a couple promising results. Andrew Bernard (Dartmouth) and Meghan R. Busse (UC Berkeley) basically looked at the two factors I identified in their article "Who Wins the Olympic Games: Economic Resources and Medal Totals".
This offers a quick gut check - I am basically on the right track. The gist of my lit review suggested that my hunch is basically in line with most researchers' thinking and that GDP and population are decent predictors of olympic performance on a country by country basis. But I couldn't find any research that looks at my corollary: which countries perform the best and which perform the worst based upon these determinants?
Getting some data
I figured this would be straight forward. All I need to do is
- rebuild Bernard and Busse's data and get it up to date
- reconstruct their model
- create some predicted medal count values
- rank countries by their residual values (observed medal counts > than predicted ones)
| country | year | gametype | medalcount | GDP | population |
|---|---|---|---|---|---|
| participant country | year of olympic game | summer or winter olympics (binary) | total medals won in given year (gold + silver + bronze) | gross domestic product in given year (curr US$) | population estimate in given year |
Bernard and Busse got their data from the International Olympic Committee (IOC) via correspondence and from the World Bank. I took a look at the IOC website and gathering data from there would be a mess. You can view results from past Olympic games, but it is organized by event, not by country. It would take a lot of work to go through each Olympic game then copy and paste data event by event, only to have to re-sort by country later. Thankfully, sports-reference.com has the data organized in basically the way I need, with one major catch: each Olympics is on a different page. As it turns out, there is no good public resource that has all Olympics lumped together in one big data sheet.
Thankfully, sports-reference.com has their website organized systematically, with "/gametype/year" as their basic site extension syntax. I put together a Python script using the BeautifulSoup package to iteratively scrape the sports-reference.com tables for each Olympic game and gather the data into one .csv. I posted my code on github here and this is my initial output. I've got my Olympic medal count data. Note: I grabbed some extra stuff (Game location, for example) since at some point it might be useful.
Off to the World Bank for GDP and population. It was pretty easy to get this data out of the World Bank DataBank except that they only store data from 1960 onwards. The first modern summer Olympics took place in 1896 (Athens) and the first winter Olympics was back in 1924 (Chamonix). I collected data that far back for medal counts, but could not find reliable data pre-1960 for my two primary independent variables. Problem? It depends. On one hand, if I only look at the 2nd half of the 20th century my analysis will be less complete. On the other hand, I suspect my model will be a better fit for the 2nd half of the 20th century anyway since I assume more developing countries participated during this period. Here is the data I grabbed on GDP and here is the population data.
Data considerations: the countries lists from the World Bank and from sports-reference.com are different. I had to cross-walk these two country lists and ended up using the World Bank country list as the master list. Also, the World Bank data is not complete for all countries in all years. This means I have to drop those data points when I run the regression. The sports-reference.com data only considers countries that actually medaled, not countries that participated but didn't medal. These will be important to the analysis, so I needed to find that info from somewhere. That somewhere ended up being wikipedia.
Wikipedia organizes
Olympic Participants into a dot matrix like the one below, which is helpful for visualizing who went to what Game,
but not very helpful for creating a data set of participants.
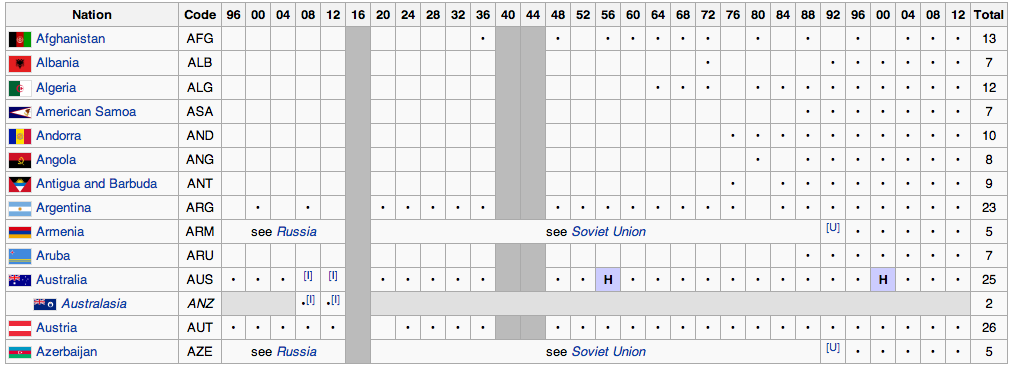 By pulling these html tables into Excel and replacing the dots with 1's and 0's, then pivoting
the data, I was able transform this into a binary variable indicating whether a country participated or not in a specific Game.
As fortune would have it, Wikipedia uses a third country list - which meant another crosswalk was required. As an aside, the medal count data is listed
by winning country, irrespective of whether that country exists any longer. As a basic rule, I retained data points for countries
that are currently in existence and are in the World Bank data, otherwise I dropped them (think Australasia, Bohemia, United Arab Republic, East Germany, etc.).
Russia first shows up at Lillehammer - to be consistent I dropped the Soviet Union from the analysis. I've only included Germany and its medals
from 1992 onwards, as Albertville was the first Games where Germany participated as a unified team since their brief participation
as a unified team from '56 - '64. The World Bank didn't have 2014 GDP or population data, so for 2014 (a Winter game) I used the previous Winter Game (2010)
GDP and population data.
I realized I needed one more piece of data. How many events occurred at each Olympics? Since I assume the number of events has grown since 1960, I need to detrend the data of this growth factor. I ended up wasting a bunch of time writing another Python script to grab this from sports-reference.com and creating this output. Only then did I realize that the sports-reference.com events list did not break out each event into its subcomponents or by gender (for example, at Sochi Alpine Skiing is comprised of Downhill, Slalom, Giant Slalom, Super-G, and Super Combined. For both men and women). Only then did I think about an easy workaround: sum the total medals awarded in a given Games as another variable.
One last thing on gathering data. World Bank has some average annual temperature data. At first glance the Nordic countries do extremely well in Winter Games. A climate thing? Or a cultural thing? Probably the latter, but I tried to bring in climate data anyway. Unfortunately, it was fairly incomplete and only captured about 140 of the 200 or so countries I want to look at. I ended up ditching it in my final analysis.
Running the numbers
Considering gathering and grooming the data took much longer than anticipated, it was nice to get to the fun stuff. I ported my data set into R and did a few things. First, I wrote a formula that sums total medal counts by Country and sorts by game type (Summer vs. Winter) since 1960. Note that here Russia excludes Soviet Union medals and Germany only includes medals from 1992 onwards.
| country | total summer medals |
|---|---|
| United States | 1,341 |
| China | 473 |
| Russian Federation | 397 |
| Australia | 383 |
| United Kingdom | 369 |
| Italy | 346 |
| country | total winter medals |
|---|---|
| Norway | 216 |
| United States | 201 |
| Germany | 174 |
| Austria | 161 |
| Canada | 127 |
| Finland | 110 |
I was definitely surprised by some of the top 6 countries. Next, I created some basic exploratory visualizations to check medal counts against my two independent variables (GPD and population) per game type by year.
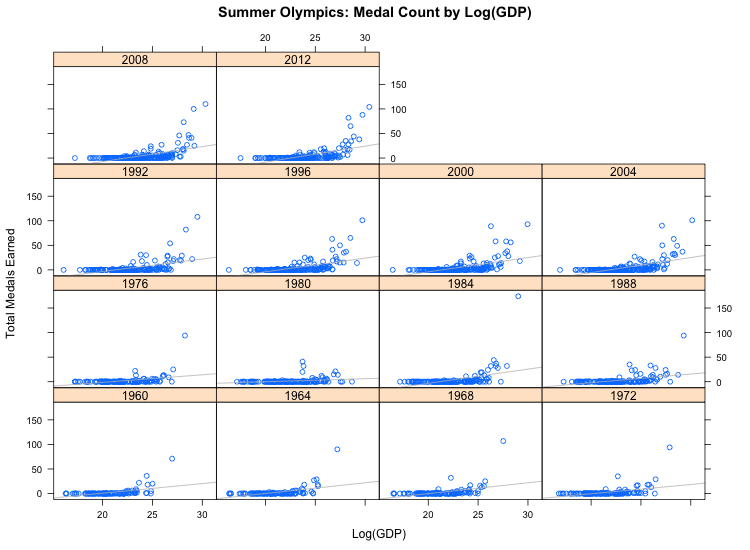
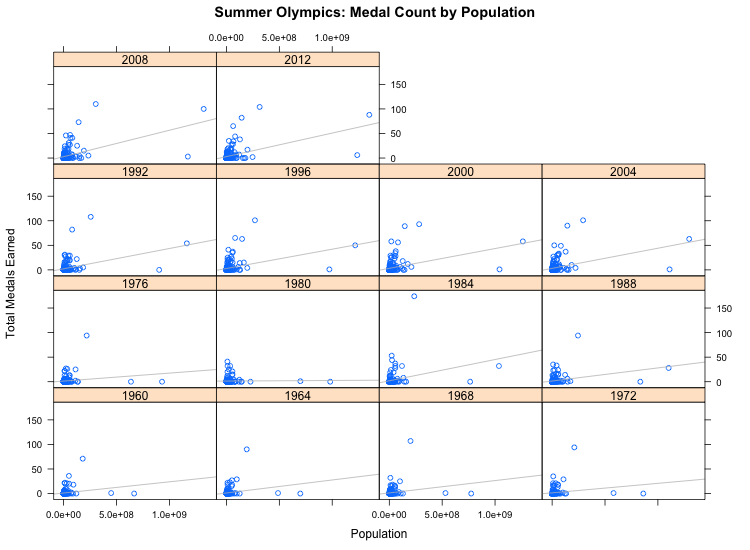
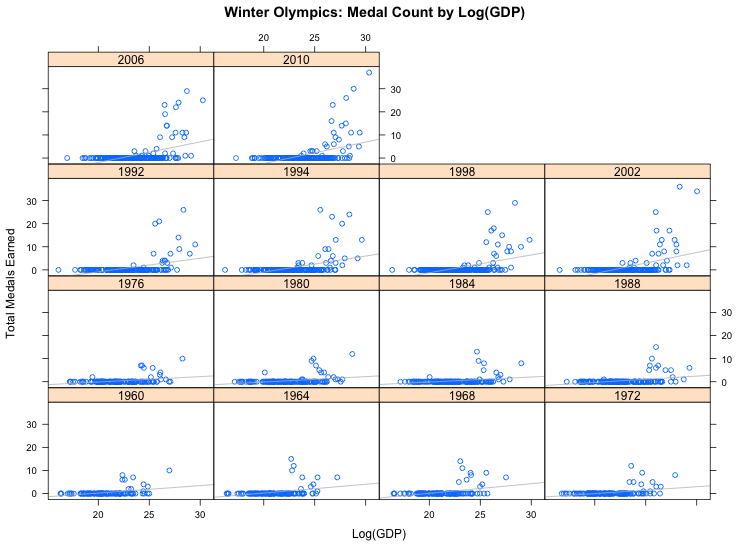
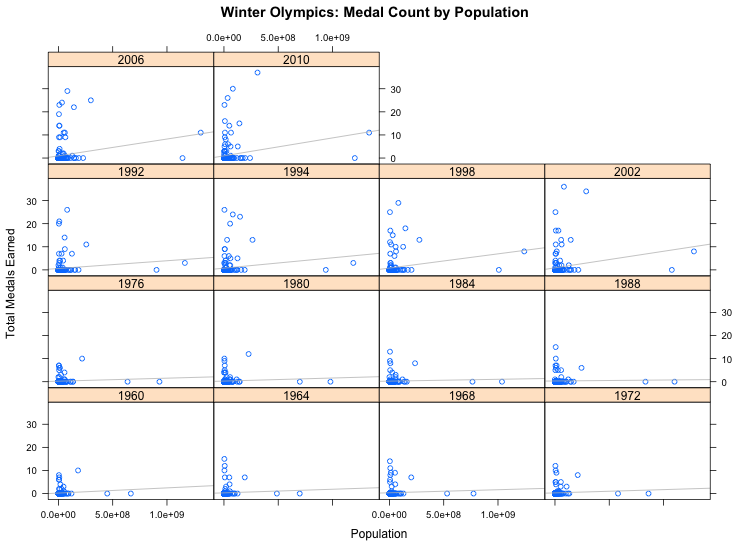
These charts aren't meant to be pretty. But what they do show is that consistently, over time, GDP and Population have both been correlated with Olympic performance. Interestingly, GDP appears to be much more strongly correlated with total medal count than does population. Also, the impact of the 1980 Olympic boycott shows up pretty clearly; wealth did not play as much of a role in that Games as it seemed to do in others. Here is the R script I used to create these plots.
I began building my model with this specification:
where di is a dummy variable for each year and MedalCountit-1 is a lag variable on medal count by country (Bernard and Busse's final specification except for a "host country" dummy variable). The dummy variables account for variability unique to each year and actually only a couple years within the sample are statistically significant (essentially the boycotted Games). The inclusion of the dummy variables do not add tremendously power to the model.
The lag variable is interesting and I am not sure how I feel about it. Including the lag variable significantly increases the predictive capacity of the model, but it moves my output away from a measurement of normalized performance and more into the realm of predictive modeling.
Bernard and Busse explain the lag variable in these terms: we can think of Olympic medals as a production function with inputs(people, money, and organizational ability). What is produced is a durable good - more like a house than a hamburger. If you build yourself a mansion in one year, you should still have a pretty impressive home four years down the road. This explains why we were disappointed when Shaun White didn't Medal in this Games. I kept the lag variable because realistically, if a country has massive economic or population growth in a 4 year period, it would still need infrastructure and organizational ability to produce athletes (athletes can't be produced in just 4 years, in most cases). So, unless that country was already a strong Olympic performer, we should temper our expectation of its performance for a period of time.
Here is the final R script I used to estimate the model. Here is the final dataset used in the analysis (with all the requisite transformation/country-crosswalks). And here is the output, including predicted values, for the Summer Games and for the Winter Games .
For those interested, here is the model summary for the Summer Games analysis. The gist of this output is actually that population and GDP have only marginal effects on Olympic performance. The biggest driver of Olympic performance is past performance (a function of existing infrastructure, training facilities, organizational ability, etc.). For Summer Games, a 1% increase in population is associated with 0.003 more Olympic medals, holding all else equal. GDP per capita is associated with essentially the same marginal effect for summer games, but the impact of GDP per capita is more pronounced for Winter Games and population is associated with a correspondingly smaller marginal effect. For every medal earned in the previous Games, we would expect about 0.9 medals in the present Games. This fits our model of thinking of Olympic talent as a durable good that depreciates over time. The intercept is negative which really doesn't mean much here relative to the magnitude of population and GDP per capita variables. The marginal effects of the lag variable, log(population), and log(GDPpercapita) suggest that to maintain strong Olympic performance over time, a country needs to continue to grow its population, base of wealth, or both.
| SUMMER | Estimate | Std. Error | t value | Pr(> |t|) |
|---|---|---|---|---|
| (Intercept) | -7.1968 | 1.4473 | -4.97 | 0.0000 |
| logPop | 0.3157 | 0.0642 | 4.92 | 0.0000 |
| logGDPperCap | 0.3076 | 0.0828 | 3.72 | 0.0002 |
| TotalAdjLagBy1 | 0.9348 | 0.0102 | 91.21 | 0.0000 |
| year.dummiesyear.f1964 | 1.0453 | 0.7137 | 1.46 | 0.1432 |
| year.dummiesyear.f1968 | 0.7315 | 0.6460 | 1.13 | 0.2576 |
| year.dummiesyear.f1972 | 0.4952 | 0.6000 | 0.83 | 0.4093 |
| year.dummiesyear.f1976 | -0.2908 | 0.6307 | -0.46 | 0.6448 |
| year.dummiesyear.f1980 | 1.1876 | 0.6876 | 1.73 | 0.0843 |
| year.dummiesyear.f1984 | 2.4811 | 0.5542 | 4.48 | 0.0000 |
| year.dummiesyear.f1988 | -1.7051 | 0.5203 | -3.28 | 0.0011 |
| year.dummiesyear.f1992 | 0.9750 | 0.5112 | 1.91 | 0.0567 |
| year.dummiesyear.f1996 | 0.2633 | 0.4978 | 0.53 | 0.5969 |
| year.dummiesyear.f2000 | 0.6869 | 0.4808 | 1.43 | 0.1532 |
| year.dummiesyear.f2004 | 0.1675 | 0.4763 | 0.35 | 0.7252 |
| year.dummiesyear.f2008 | 0.1597 | 0.4737 | 0.34 | 0.7361 |
| year.dummiesyear (none) | ||||
| Residual standard error: 4.492 on 1603 degrees of freedom | ||||
| Multiple R-squared: 0.8843 | Adjusted R-squared: 0.8832 | |||
| F-statistic: 816.7 on 15 and 1603 DF, p-value: < 2.2e-16 | ||||
| WINTER | Estimate | Std. Error | t value | Pr(> |t|) |
|---|---|---|---|---|
| (Intercept) | -6.3598 | 1.6191 | -3.93 | 0.0001 |
| logPop | 0.2121 | 0.0606 | 3.50 | 0.0005 |
| logGDPperCap | 0.3980 | 0.0994 | 4.01 | 0.0001 |
| TotalAdjLagBy1 | 0.9036 | 0.0221 | 40.92 | 0.0000 |
| year.dummiesyear.f1964 | 1.1846 | 0.7211 | 1.64 | 0.1009 |
| year.dummiesyear.f1968 | 0.5531 | 0.6664 | 0.83 | 0.4069 |
| year.dummiesyear.f1972 | -0.5920 | 0.6947 | -0.85 | 0.3944 |
| year.dummiesyear.f1976 | -0.4921 | 0.6514 | -0.76 | 0.4503 |
| year.dummiesyear.f1980 | -0.0015 | 0.6457 | -0.00 | 0.9981 |
| year.dummiesyear.f1984 | -0.4427 | 0.5872 | -0.75 | 0.4511 |
| year.dummiesyear.f1988 | -0.0946 | 0.5378 | -0.18 | 0.8604 |
| year.dummiesyear.f1992 | 0.6380 | 0.5213 | 1.22 | 0.2215 |
| year.dummiesyear.f1994 | -0.1697 | 0.5103 | -0.33 | 0.7395 |
| year.dummiesyear.f1998 | 0.0769 | 0.4741 | 0.16 | 0.8713 |
| year.dummiesyear.f2002 | 0.1868 | 0.4627 | 0.40 | 0.6866 |
| year.dummiesyear.f2006 | -0.1618 | 0.4533 | -0.36 | 0.7213 |
| year.dummiesyear.f2010 | -0.3978 | 0.4575 | -0.87 | 0.3850 |
| Residual standard error: 2.744 on 613 degrees of freedom | ||||
| Multiple R-squared: 0.806 | Adjusted R-squared: 0.8009 | |||
| F-statistic: 159.1 on 16 and 613 DF, p-value: < 2.2e-16 | ||||
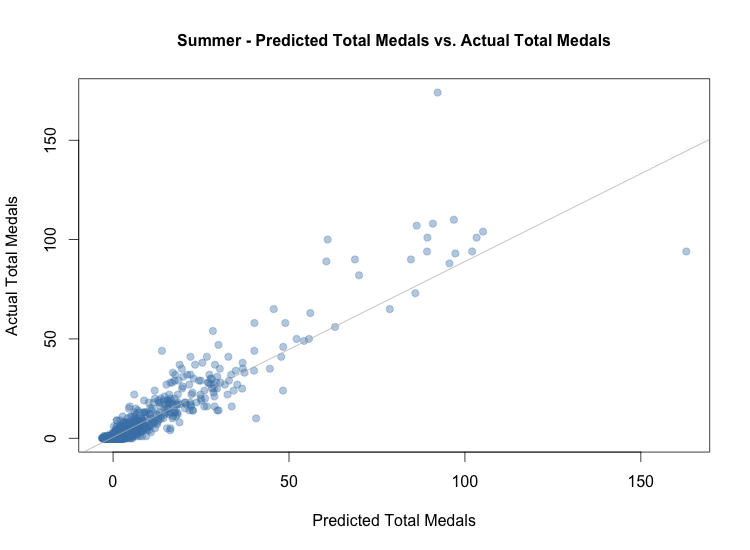
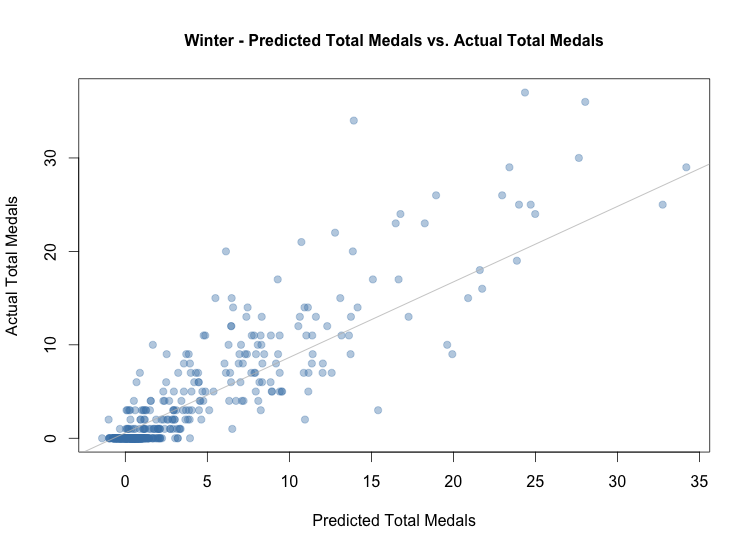
and here are some basic visualizations to evaluate the effectiveness of the estimator:
Visualizing a narrative
My attempts at visualizing a story went through a few iterations. At first, I imagined I would create an overall rank and visualize that. I was discouraged from doing this for a couple reasons:
- I didn't include the Soviet Union so an aggregate visualization might heavily skew towards the U.S which could cause the viewer a bias that would be difficult to overcome via footnote.
- My analysis only reaches back as far as I had World Bank data (1960, and really 1964 since I used a lag variable) so an aggregate performance overview would favor recent performance over performance in the early days.
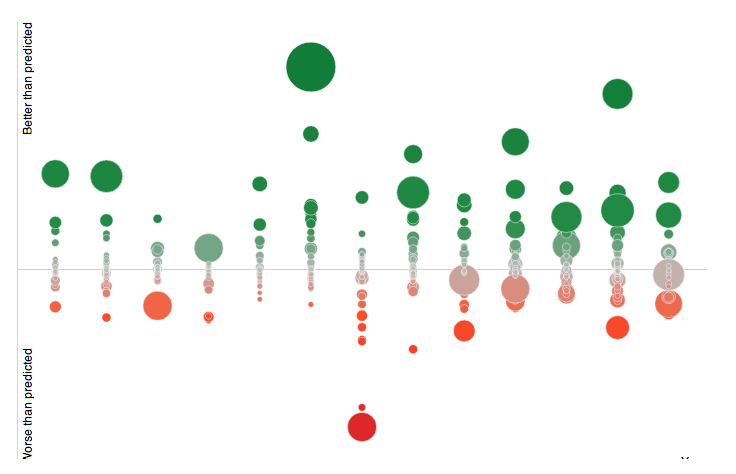 Despite the tooltip on hover, it was still difficult to see a lot of the countries, since
my model was pretty good at predicting countries who typically earn <1 medal. These countries
ended up overlapping in clusters around the mid-point. Also, it is difficult to access
the medal count for a selected country in a year other than the one selected on hover.
In attempt #2 I tried to implement a
D3.js
force layout to essentially push each scatter point away from one another. This would hypothetically
solve the overlapping problem, but the y-axis would become ordinal instead of linear. As an affordance, it seemed
worth trying out. My attempt
is live here
and is worth a look (spoiler: things fly around). It looks something like this:
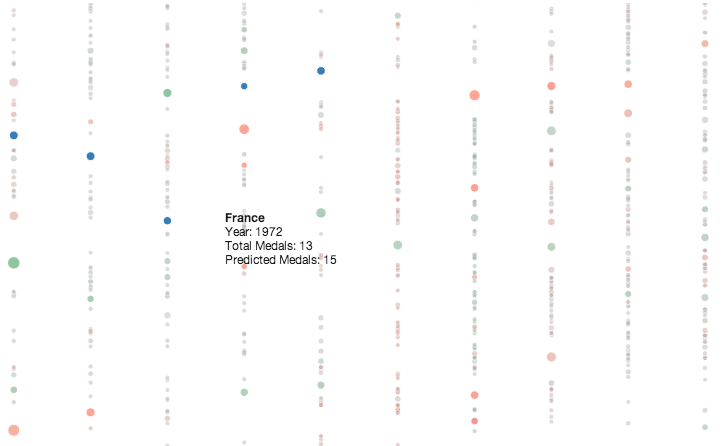 After a struggle, I was able to set the proper foci around each year, but I couldn't figure out a way to create a gravity
system that would cause the scatter points to actually achieve equilibrium in any set order.
I settled for adding some noise to the x-axis values of each scatter point to reduce
the overlap as much as possible. I also added a table to the right of the scatter plot which
provides the detailed medal count (gold, silver, bronze, actual total, predicted, and residual)
for the hovered over country in each year it participated. I included a toggle to allow the viewer to switch
between Summer and Winter games and you can check out the
live version here
which looks like this:
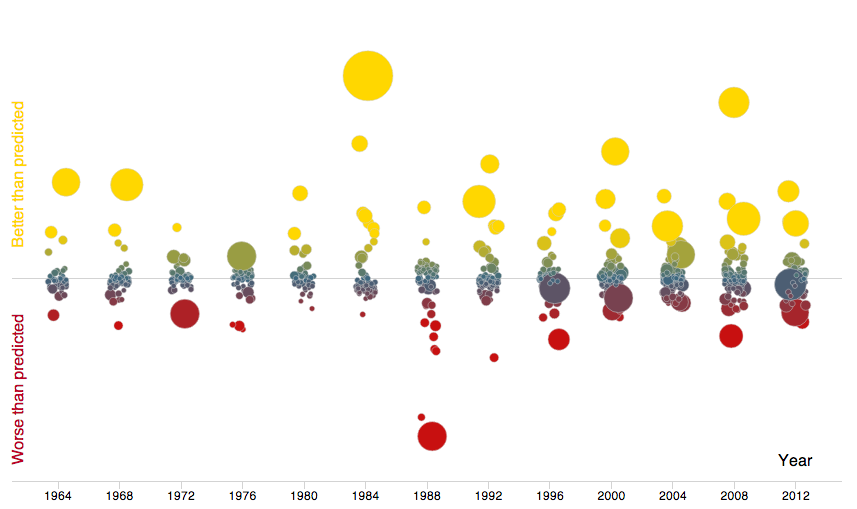 Take a look and you can see how my analysis of Sochi performance measures up against how NBC framed things
in their "Medals Race"
