A sandbox, & other things.
I'm Brandon Rose. This is a site I use to host some of my ongoing personal projects. Let me know what you think of these data visualizations and data science guides, all of which you can get code for on my github. Hit me up on Twitter @brandonmrose with questions or feedback.
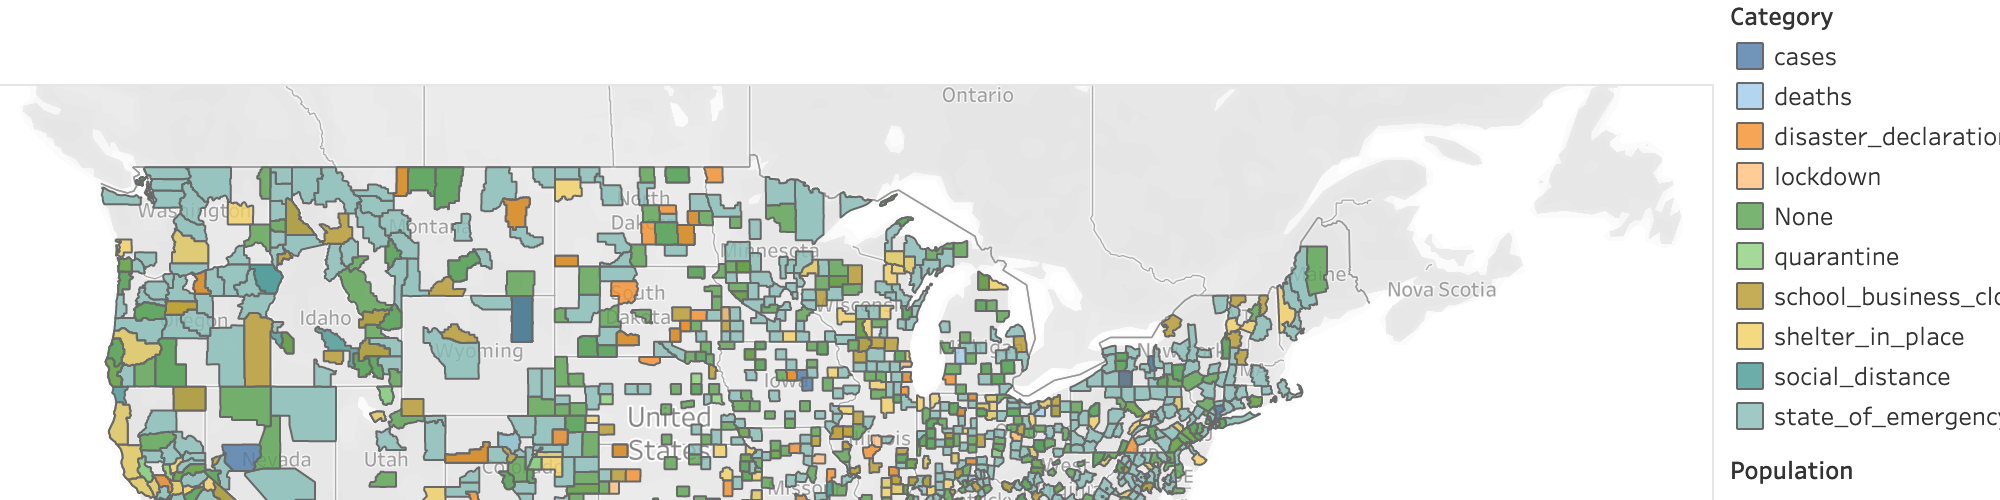
COVID-19 Policy Tracker
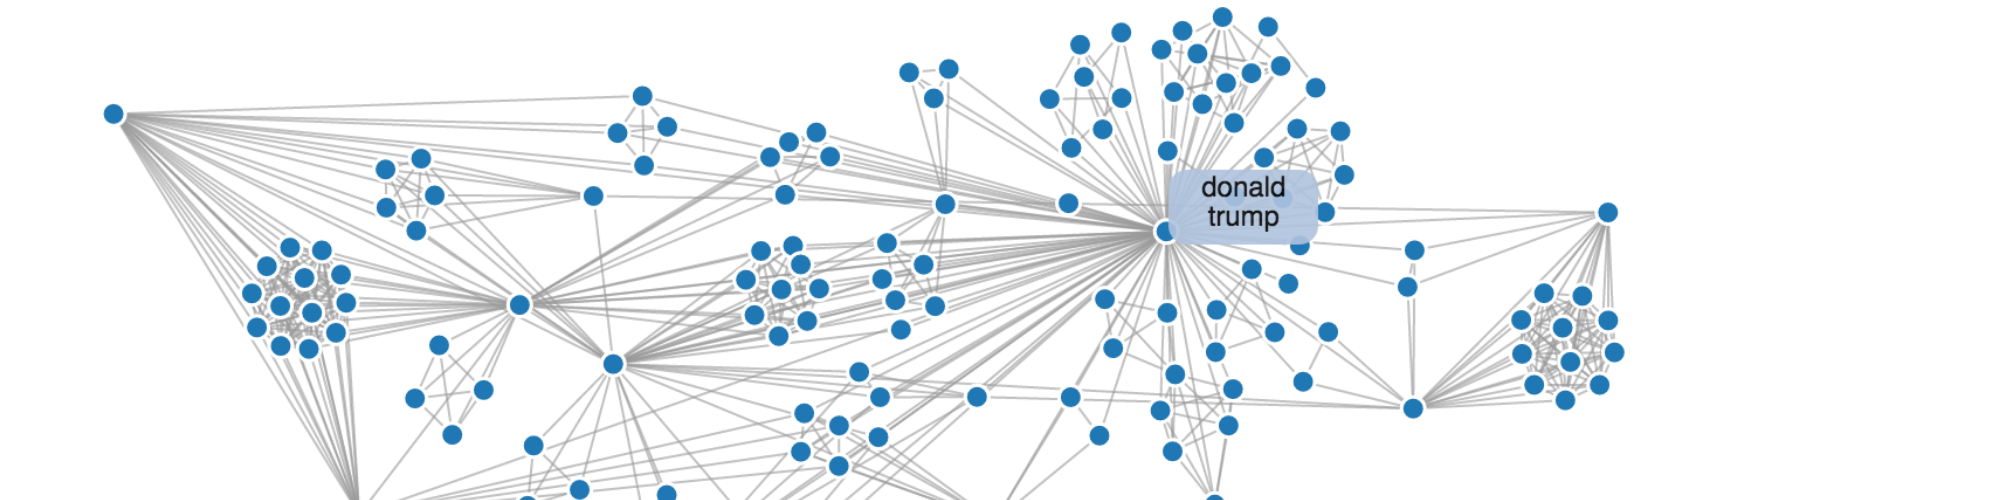
Entity Extraction and Network Analysis
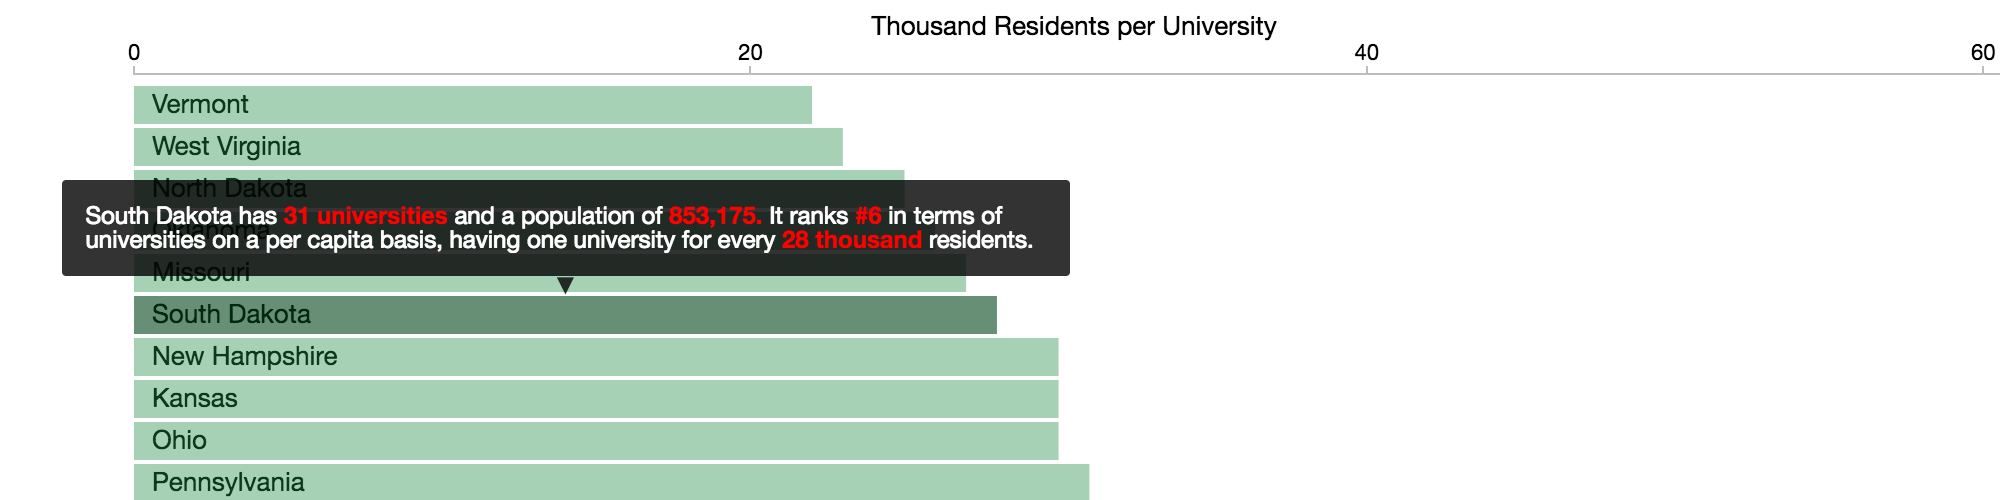
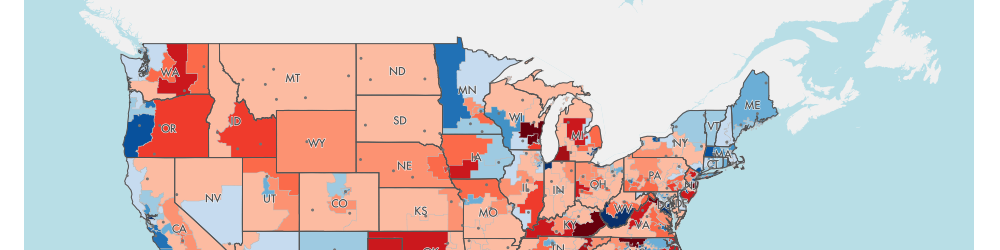
Higher Education Institutions by State
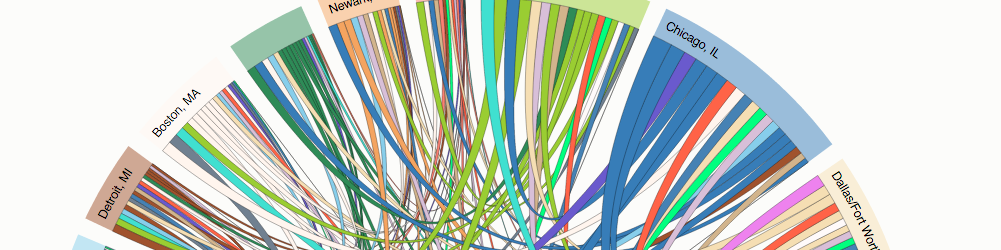
Airline passenger flow in 2014
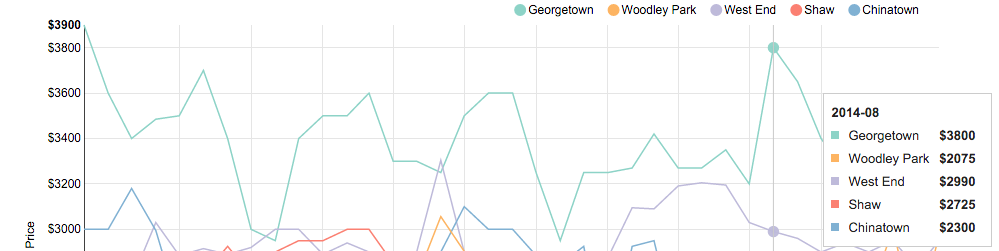
Washington DC rent for the last 3 years
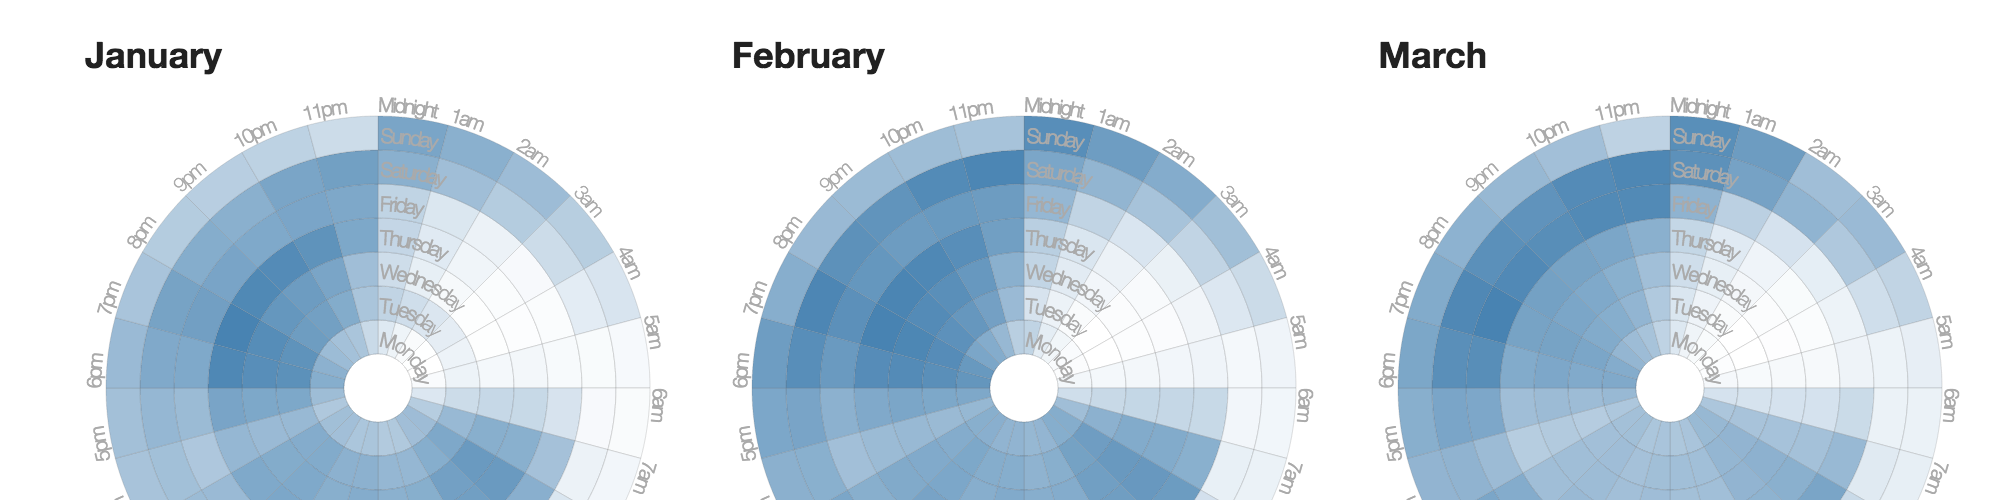
A week's worth of patent applications.

NYC taxi data, visualized.
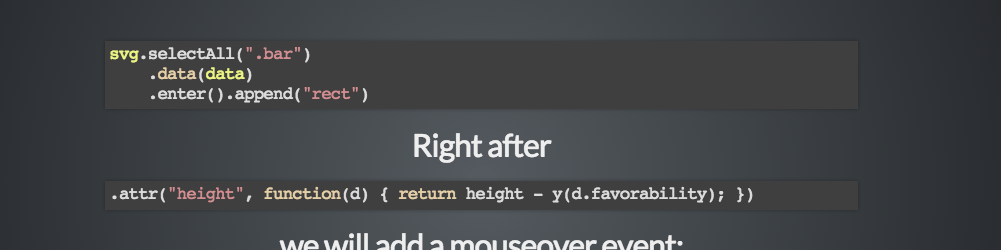
How to: an interactive bar chart with D3.js
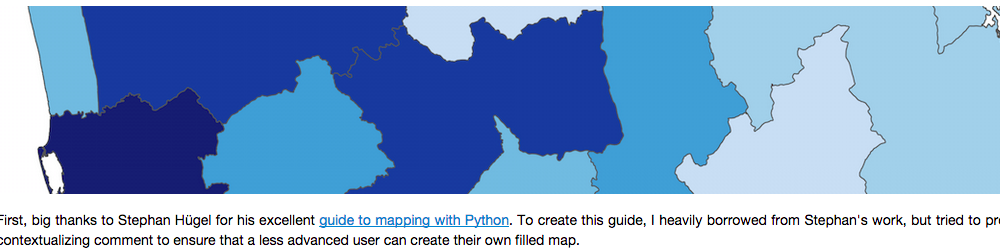
Create a filled map (chloropleth) with Python
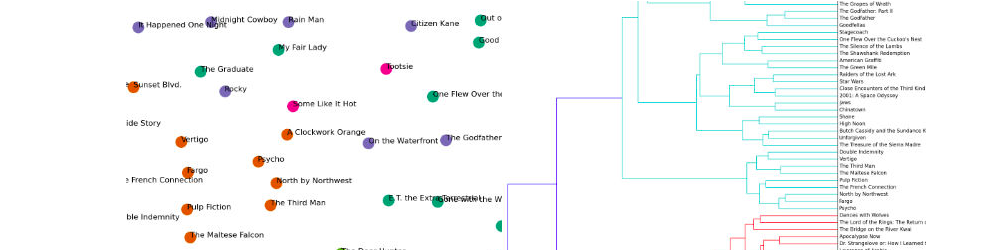
Top 100 Films of all Time
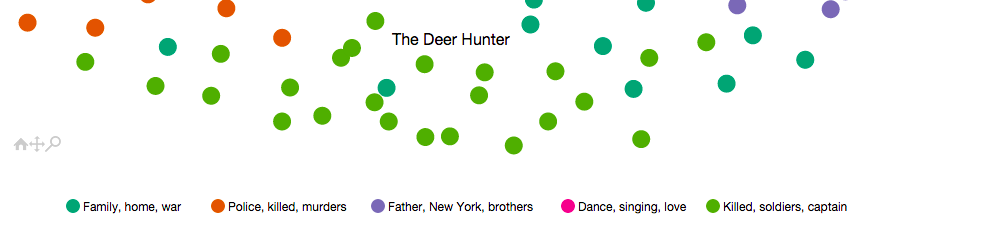
Document Clustering with Python
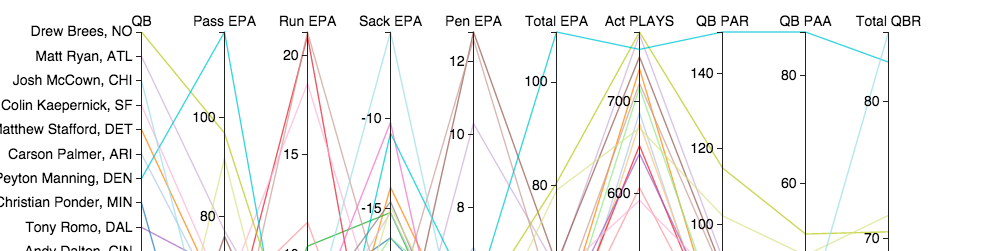
Top 20 Quarterbacks from ESPN's 2013 Total Ratings
113th Congress by Seniority
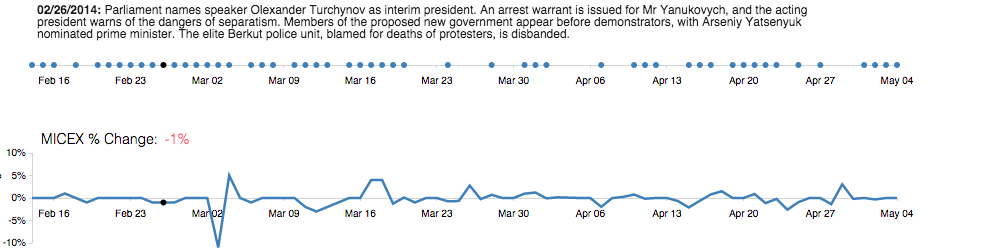
Ukraine Crisis Timeline adapted from the BBC
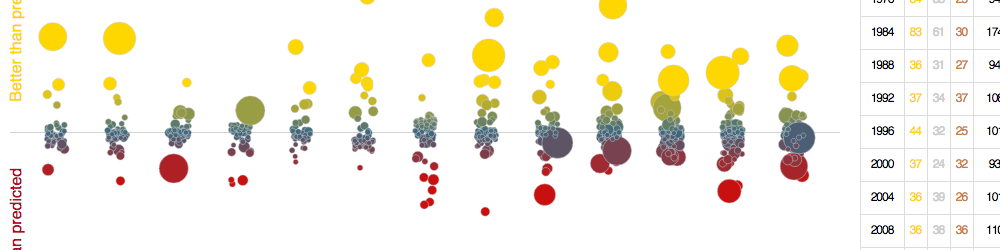
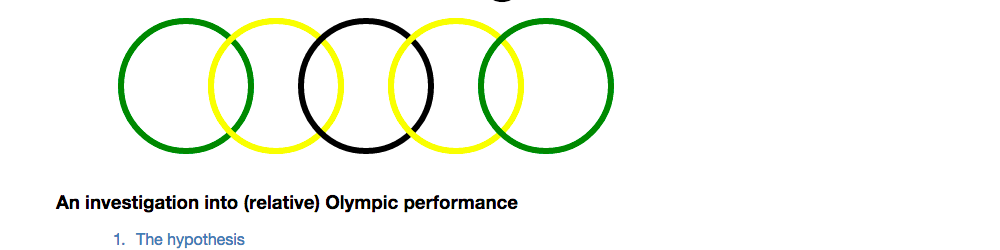
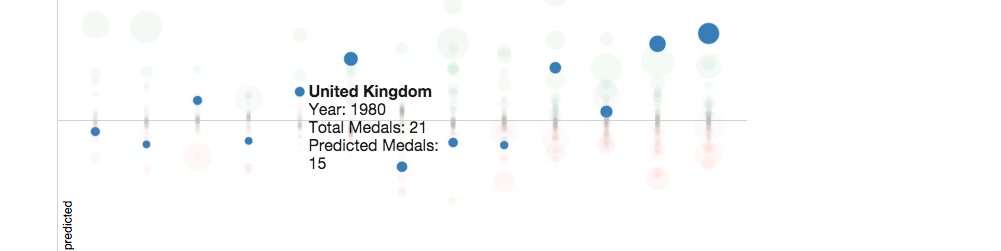
Visualizing Olympic Performance
The Cool Runnings Count
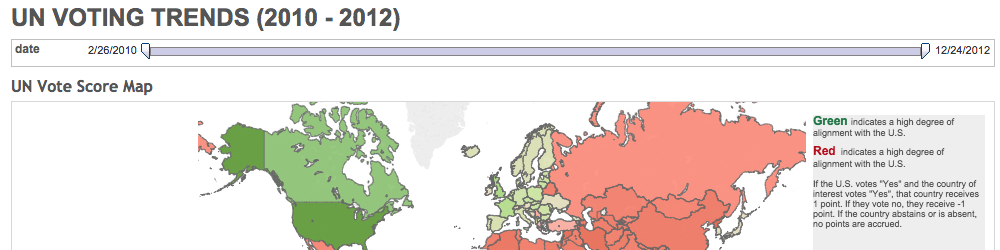
Thinking about the UN
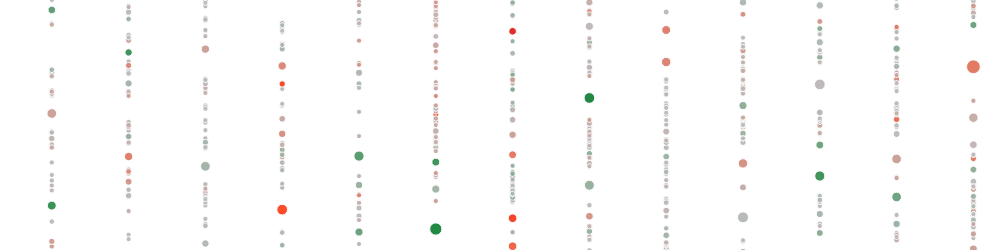
Multi-foci force layout scatterplot #fail
Olympic Viz Take #1
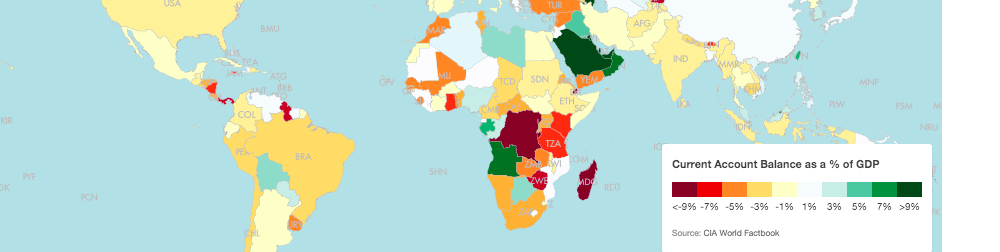
Current Account Balance as a % of GDP (2013)
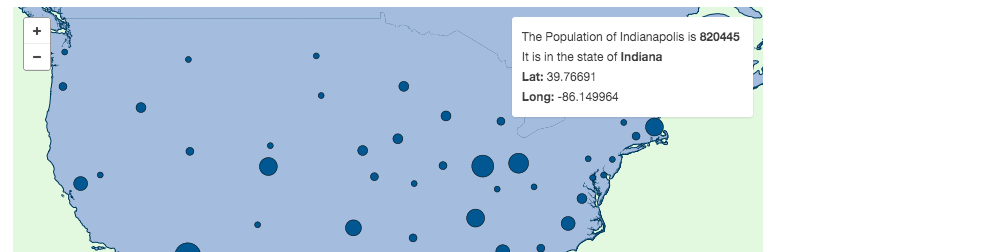
U.S. Capitals by Population